
Guides › Reading the Business Dashboard
Reading the Business Dashboard
RBTERP team · · 3 min read
What each part of RBTERP's business dashboard tells you, which figures to check daily and weekly, and how to act on what you see.
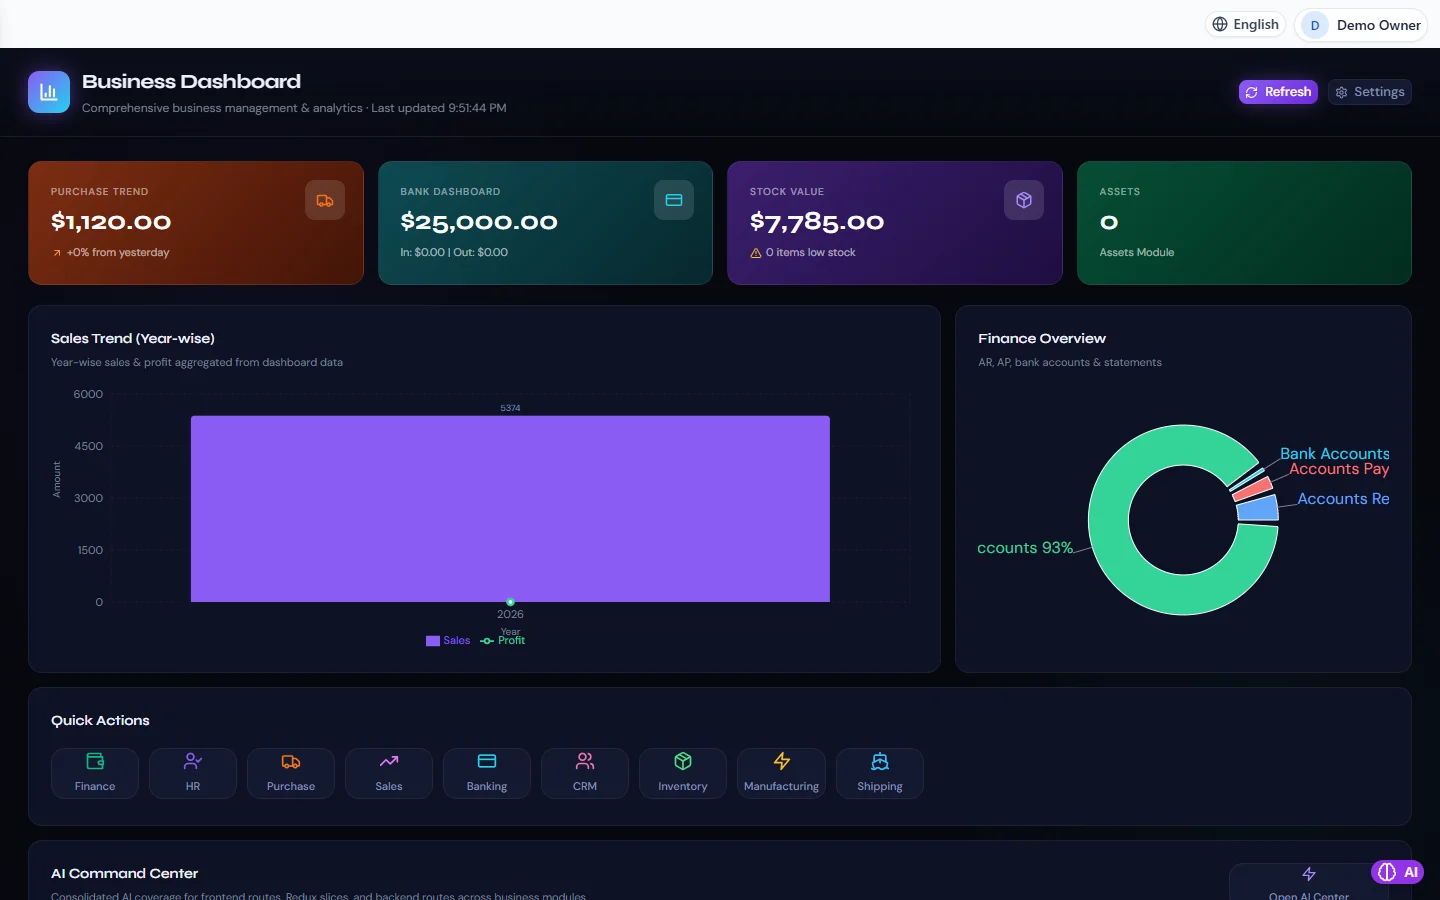
Business Dashboard in RBTERP, with a sample company and fictional data.
A dashboard is only useful if you know what each figure means and what to do when it moves. This guide walks through RBTERP's business dashboard and turns it into a short daily and weekly routine.
What the dashboard is for
The dashboard puts the whole business on one screen: what you have bought, what is in the bank, what your stock and assets are worth, how sales are trending, and what customers and suppliers owe. Every figure is read from the same records the modules use, so it agrees with the detailed reports underneath it.
It is not a replacement for closing the month or reading the financial statements. It is the place you look first, to decide where to look next.
The parts of the screen
KPI cards
Cards across the top show purchases, bank balances, stock value and assets at a glance. Read them as questions:
- Bank: is there enough cash for this week's payments and payroll?
- Stock value: is it rising faster than sales? Then money is being tied up on the shelves.
- Purchases: is spending in line with what you planned?
- Assets: a reminder of what the business owns, and of depreciation still to come.
Sales and profit trend
The year-wise sales and profit trend shows whether the business is growing and whether profit grows with it. Sales rising while profit stays flat usually means margins are being squeezed: discounts, higher costs or a change in what is selling.
Finance overview
Receivables, payables and bank accounts side by side. Together they answer the most important short-term question: can the business meet what it owes from what it has and what it is owed?
Quick actions
One-click access into Finance, HR, Purchase, Sales, Banking, CRM, Inventory, Manufacturing and Shipping, so the dashboard is also your starting point for daily work.
AI Command Center
A starting point for questions across modules.
A daily routine of five minutes
- Bank balance: any surprise? An unexpected drop needs an explanation today, not at month-end.
- Yesterday's sales: roughly as expected?
- Anything overdue to pay: check the finance overview before suppliers start calling.
A weekly routine of fifteen minutes
- Receivables: who owes, and how much is overdue? Assign the follow-up calls. See receivables ageing and collections.
- Cash outlook: compare the bank balance with the next weeks' payments. The Bank module's cash-flow forecast looks 30, 60 and 90 days ahead.
- Stock: look at the low-stock alerts in Inventory and place orders.
- Sales trend: is this week in line with recent weeks?
Common misreadings
- A high bank balance is not profit. It may include customer advances, tax you have collected and must pay over, or a loan.
- Sales are not cash. A large sales month with slow collections can leave the bank lower than before.
- Stock is cost, not selling value. The dashboard shows what goods cost you.
- Figures in an open month can still change as late documents are entered. Treat them as provisional until the month is closed.
When a figure looks wrong
Open the module behind it and follow the figure down to the documents. Because every number comes from the same records, a wrong dashboard figure always traces to a specific document: a missing invoice, a payment in the wrong month, or a stock movement at the wrong cost.
This guide uses the Business Dashboard module of RBTERP: Purchases, bank balances, stock value and assets at a glance, with sales trends, a finance overview and one-click access to every module.