
Guides › Quality Inspections and Production Efficiency
Quality Inspections and Production Efficiency
RBTERP team · · 3 min read
How to inspect production, measure planned against actual output, on-time delivery and workstation use, and turn the figures into improvements.
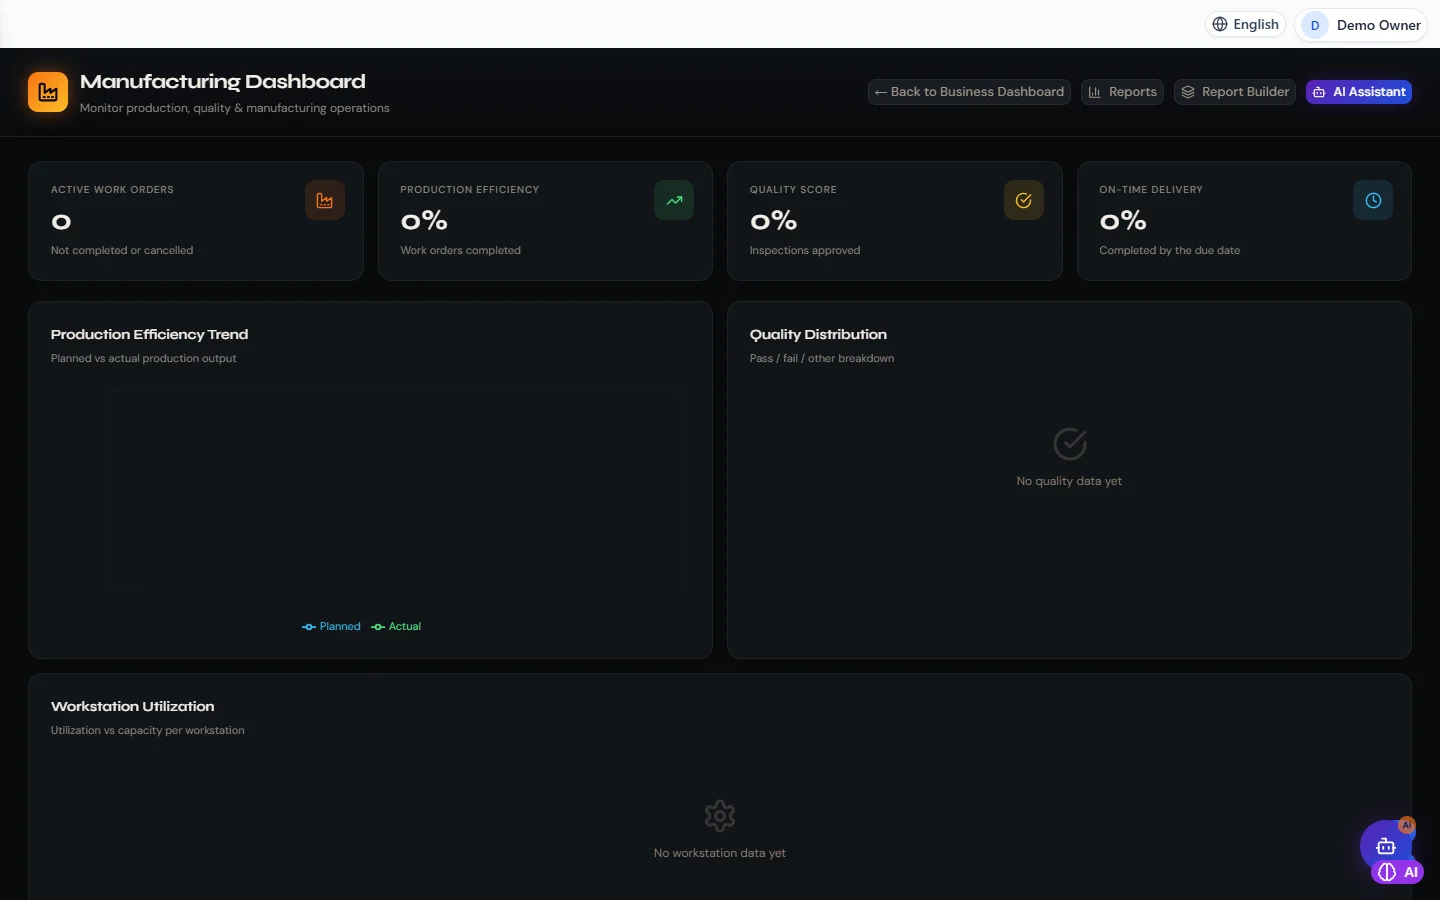
Manufacturing in RBTERP, with a sample company and fictional data.
Making products is only half the job. The other half is knowing whether they are made well, on time and efficiently. A few simple measures, recorded consistently, show where production loses time and money.
Quality inspections
An inspection checks a product against its specification. Decide:
- What to inspect: incoming materials, work in progress at key steps, finished goods.
- How many: every unit for critical products, a sample for the rest.
- Against what: written criteria, so two inspectors reach the same result.
- What happens to a failure: rework, scrap, or return to the supplier.
Record every inspection with its result, even the passes. A pass rate is only meaningful if you know how many were inspected.
The pass/fail breakdown
Group failures by cause: material defect, machine setting, operator error, design problem. A handful of causes usually account for most failures. Fix those first.
Production efficiency
Efficiency compares what was produced with what was planned:
actual output ÷ planned output
A line planned to make 1,000 units in a shift that makes 850 is running at 85%. Track it by product, by line and by shift. Falling efficiency is an early sign of machine wear, material problems or staffing gaps.
On-time delivery
How many work orders were completed by their due date? Customers notice lateness before they notice anything else. Track it monthly, and look at the late orders individually: were materials short, was capacity overbooked, or was the plan unrealistic?
Workstation utilisation
Utilisation compares the time a workstation was used with the time it was available. A machine used 30% of the time may not be needed; one used 95% of the time is a bottleneck that delays everything behind it. Plan around the bottleneck, and maintain it first.
Maintenance
Breakdowns destroy efficiency and delivery dates. Schedule preventive maintenance by time or usage, and track whether it is done on schedule.
Turning figures into action
- Review the four measures every week: pass rate, efficiency, on-time delivery, utilisation.
- Pick the worst one and find its main cause.
- Make one change, and watch the measure for a month.
- Repeat.
Small, steady improvements in these figures add up to large savings in materials, overtime and lost customers.
Quality and efficiency in RBTERP
RBTERP's Manufacturing module shows these measures on its dashboard, every figure counted from the records:
- Quality inspections with a pass/fail breakdown.
- Production efficiency: planned against actual output.
- On-time delivery against each work order's due date.
- Workstation utilisation against capacity.
- Work-order progress as the share of its job cards completed, with labour efficiency and cost from recorded hours.
- Maintenance schedules, whose status comes from the next due day against today.
- Scrap is recorded at the cost it carried, so the cost of quality failures shows in the accounts, not only on the shop floor.
Dashboard figures are calculated over every order and inspection, so they agree with the detailed lists. Access is limited by role: a view-only supervisor can read the figures and never change records.
For setting up products and recipes, see bills of materials and work orders. Have the weekly figures e-mailed to you with automated report subscriptions.
This guide uses the Manufacturing module of RBTERP: Work orders, production efficiency, quality inspections and workstation utilisation.