
Guides › Building Your Own Reports
Building Your Own Reports
RBTERP team · · 3 min read
How to design a useful business report: start from the decision, choose the right figures and filters, and avoid reports nobody reads.
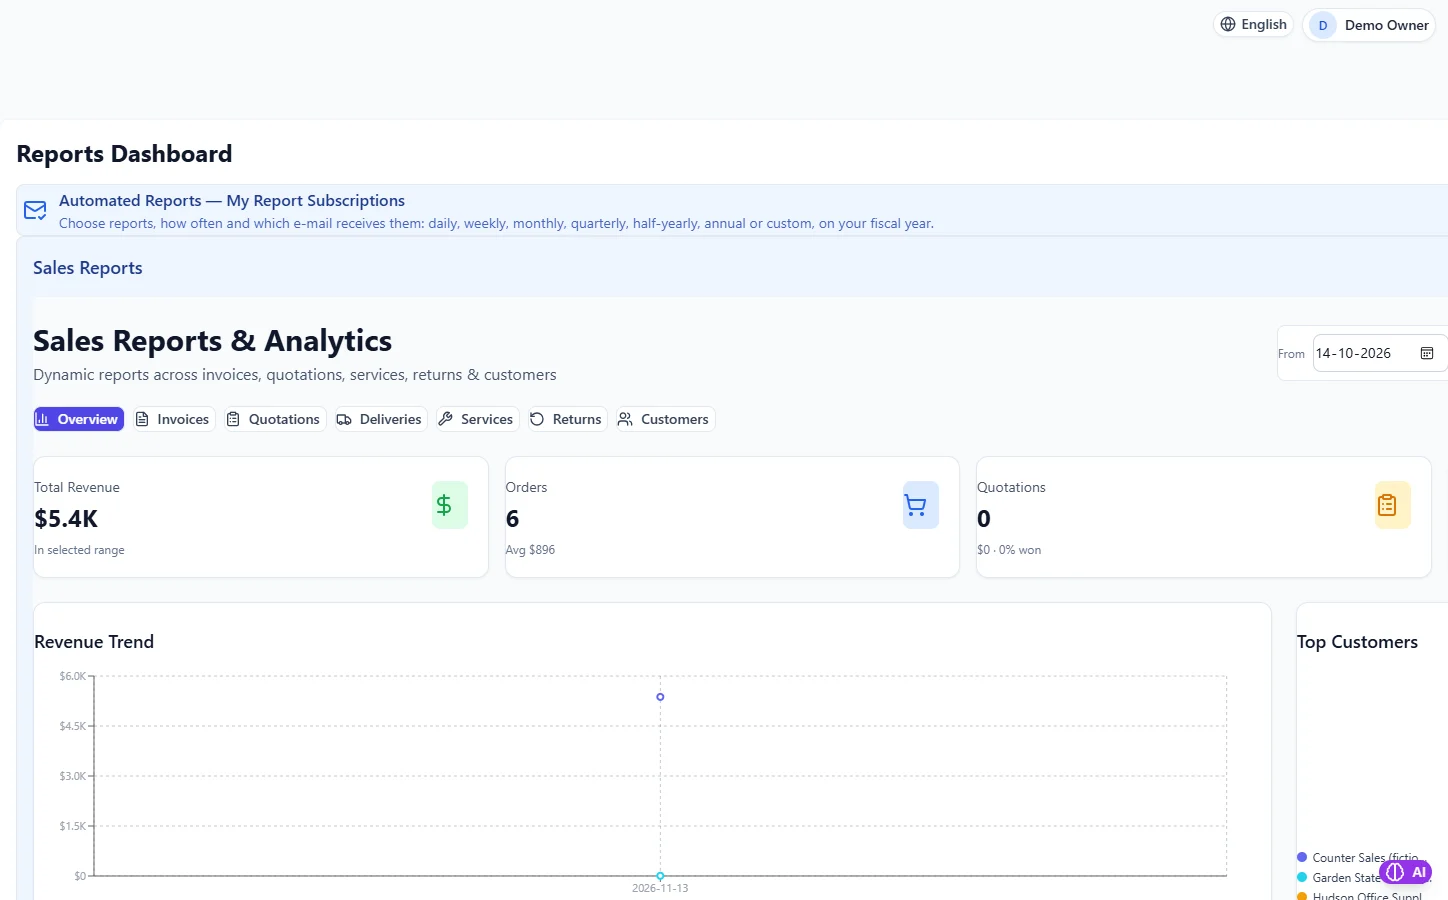
Reports & Analytics in RBTERP, with a sample company and fictional data.
Standard reports answer standard questions. Sooner or later you will have a question of your own: which customers bought less this quarter than last, which products sell best in which branch, which suppliers deliver late most often. A custom report answers it. This guide is about designing reports that people actually use.
Start from the decision
Before choosing columns, write down the decision the report supports:
- "Which customers should the sales team call this week?"
- "Which products should we stop stocking?"
- "Where are we overspending against last year?"
A report without a decision behind it becomes a long table nobody reads.
Choose the figures
For each decision, pick the few figures that answer it. For the customer call list:
- Customer name and contact.
- Sales this quarter and last quarter.
- The difference.
- Last order date.
Four or five columns are usually enough. Each extra column makes the answer harder to see.
Filters and sorting
- Filter to what matters: active customers only, one branch, one product category.
- Sort so the most important rows come first: the largest drop at the top.
- Limit the length: the top twenty is often more useful than the full list.
Choose the period carefully
- Compare like with like: a quarter with the previous quarter, or the same quarter last year.
- Watch for open periods: figures for the current month will change.
- Use the same period definitions every time, so reports can be compared.
Show trends, not just totals
A single number tells you where you are. A trend tells you where you are going. Where it helps, show the same figure over several periods, or as a simple chart.
Check it once against a known figure
Before relying on a new report, check one figure against a report you trust, such as total sales for the month against the profit and loss. If they differ, find out why before anyone makes a decision on it.
Keep reports alive
- Give each report an owner who reads it.
- Delete reports nobody has opened in three months.
- Revisit the decision behind each report once a year; the business changes.
Reports in RBTERP
RBTERP's Reports and Analytics module provides:
- Sales reports and analytics for any date range, covering invoices, quotations, deliveries, services, returns and customers.
- Revenue trend and top customers.
- A report builder for your own reports, and in the CRM, a drag-and-drop report builder alongside its analytics and AI insights.
- Excel export for further analysis, through Integrations. See Excel import and export.
- Every module's dashboard figures are calculated from the same records the reports use, so a figure on a dashboard and the same figure in a report agree.
Once a report is useful, have it delivered on a schedule, so it arrives without anyone having to remember. See automated report subscriptions.
Five reports worth building
- Customers buying less: sales this quarter against last, largest drop first.
- Slow-moving stock: products with stock on hand and no sales in ninety days.
- Margin by product: sales, cost and gross margin, lowest margin first.
- Late suppliers: orders received after their due date, by supplier.
- Expense trend: each expense account by month, against the same month last year.
If you would like help designing reports for your business, our Consulting service covers reporting along with your chart of accounts, approvals and stock control.
This guide uses the Reports & Analytics module of RBTERP: Dynamic reports across invoices, quotations, deliveries, services, returns and customers, and automated reports e-mailed on your schedule.