
Guides › Chart of Accounts for a Trading Company
Chart of Accounts for a Trading Company
RBTERP team · · 4 min read
How to design a chart of accounts for a business that buys and sells goods: the groups you need, how to number them, and mistakes to avoid.
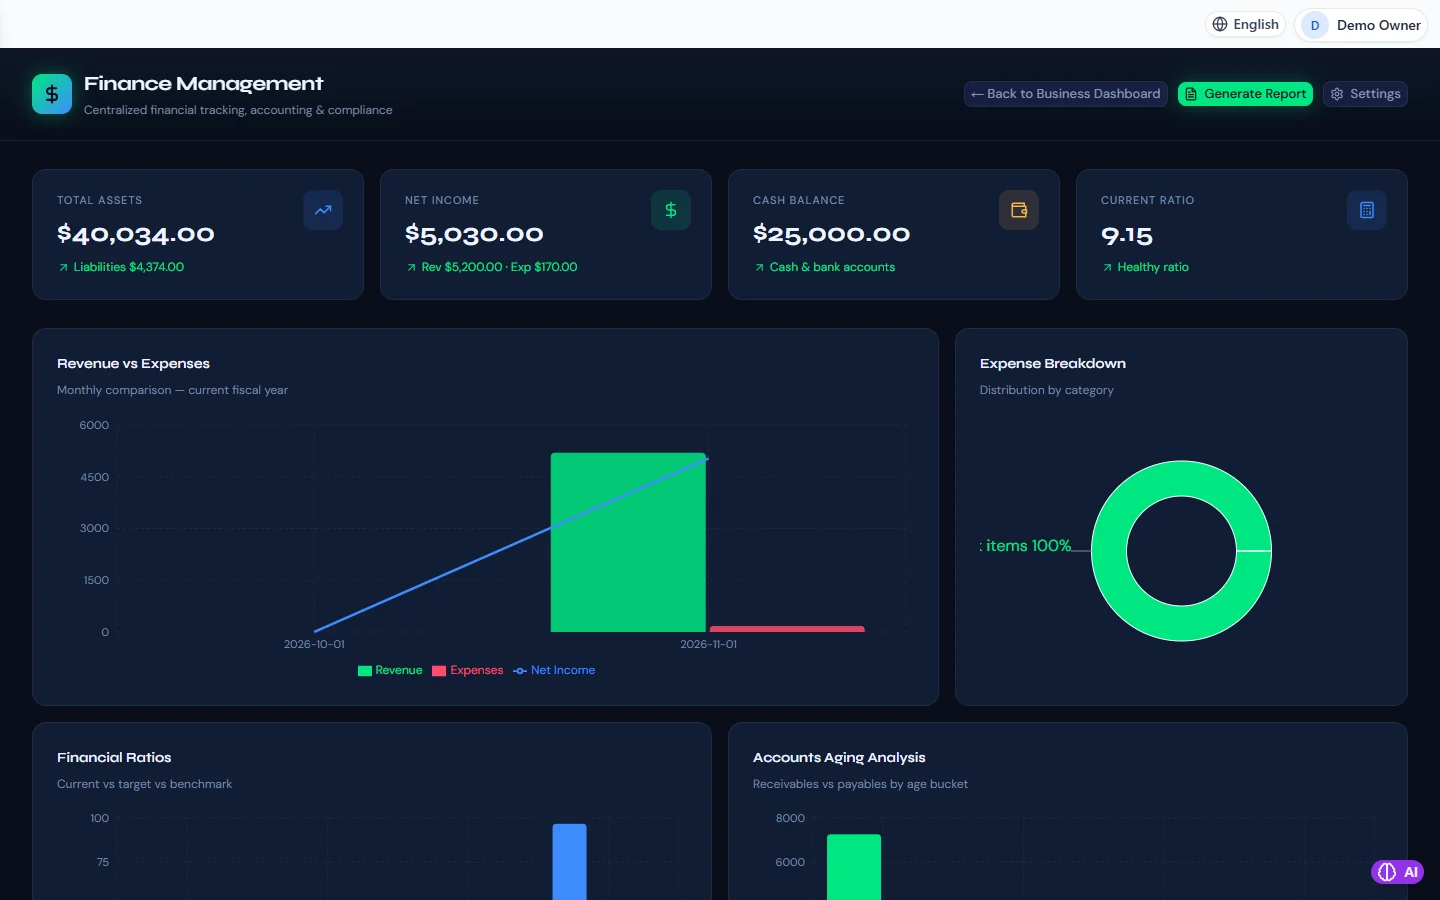
Finance & Accounting in RBTERP, with a sample company and fictional data.
The chart of accounts is the list of headings your business keeps its books under. Every sale, purchase and payment ends up in one of them. A good chart makes your reports readable without any extra work. A poor one produces a profit and loss account nobody can interpret, however carefully the entries are made.
The five groups
Every chart, in every country, is built from the same five groups:
- Assets: what the business owns or is owed. Cash, bank accounts, money customers owe you, stock, equipment.
- Liabilities: what the business owes. Suppliers, taxes collected for the government, loans.
- Equity: the owners' share. Capital paid in, and profit kept in the business.
- Income: what the business earns. Sales, less returns and discounts.
- Expenses: what it costs to earn it. The cost of the goods sold, then salaries, rent and the rest.
Assets, liabilities and equity make up the balance sheet. Income and expenses make up the profit and loss account.
What a trading company needs
A business that buys goods and sells them has a few accounts it cannot do without:
- Accounts receivable. One control account for everything customers owe, with the detail per customer kept underneath it.
- Inventory. The cost of goods you hold and have not yet sold.
- Accounts payable. One control account for everything you owe suppliers.
- Sales tax accounts. Tax you have charged customers and tax you have paid suppliers are not your income or your expense. Keep them in their own accounts.
- Sales revenue, with sales returns kept separately so you can see how much comes back.
- Cost of goods sold. The cost of the items actually sold in the period. Sales minus this is your gross profit, the most useful single number a trader has.
- Operating expenses, grouped the way you think about the business: salaries, rent, utilities, transport, bank charges.
Numbering
Number the accounts so that each group has its own range and there are gaps to grow into. A common layout:
- 1000 to 1999: assets
- 2000 to 2999: liabilities
- 3000 to 3999: equity
- 4000 to 4999: income
- 5000 to 5999: cost of goods sold
- 6000 to 6999: operating expenses
Leave space between accounts. If your bank accounts are 1010 and 1020, a third bank account has somewhere to go.
How much detail
Enough to answer the questions you actually ask, and no more.
- Too few accounts: one "expenses" account tells you nothing about where the money went.
- Too many accounts: a separate account for each supplier's delivery charge means nobody chooses the right one, and the detail becomes unreliable.
A useful test: would you make a different decision if this figure were split out? If yes, give it an account. If you only want to analyse sales by customer or by product, you do not need extra accounts; that detail belongs in the sales records.
Mistakes to avoid
- Mixing purchases and cost of goods sold. Stock you buy is an asset until you sell it. If every purchase is expensed straight away, profit swings with your buying, not your selling.
- Posting by hand to control accounts. Receivables, payables and inventory should move only through invoices, bills, payments and stock movements. A manual journal to a control account breaks the agreement between the ledger and the customer, supplier or stock list.
- One account for all taxes. Keep sales tax, income tax withheld and payroll deductions apart. They are paid to different bodies on different dates.
- Renumbering after you start. Changing the structure once transactions exist is painful. Spend the time at the beginning.
How RBTERP uses the chart
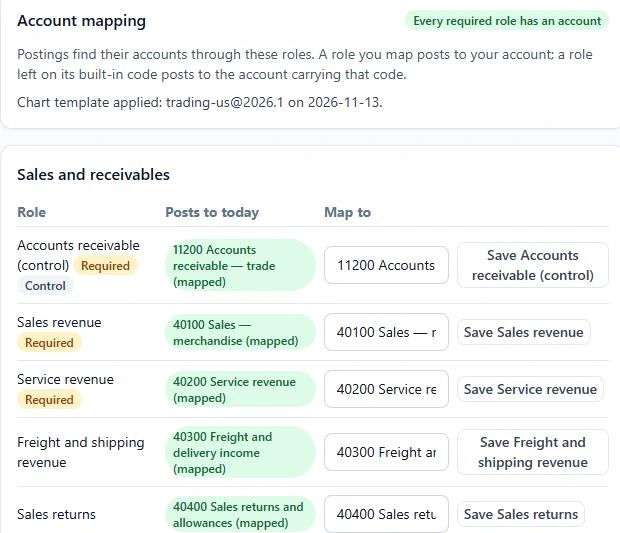
In RBTERP you do not choose an account each time you enter an invoice. Every document posts through posting roles, such as accounts receivable control, sales revenue, inventory and cost of goods sold. There are 42 of them, and each role is answered by an account in your chart.
- A chart template creates a complete chart and maps every role in one step. You preview it first: the accounts it will create, the ones already present, and any conflicts.
- If you do not map a role, RBTERP uses the account carrying that role's built-in code, for example 1100 for receivables, 1200 for inventory, 4000 for revenue and 5000 for cost of goods sold.
- You can map any single role to your own account under Settings, then Account mapping. The account must be active, must be a detail account and not a heading, and must be of the right class.
- Customer, supplier and product accounts are created automatically underneath the mapped control account.
A template can only be applied before the first posting, which is one more reason to settle the chart before you begin. If you are moving from spreadsheets, read moving from Excel to an ERP next.
This guide uses the Finance & Accounting module of RBTERP: Every invoice, bill, payment and stock movement posts to a double-entry general ledger, with ratios, ageing and financial statements ready when you need them.